Our Best Intel: U.S. Consumer Sectors Outlook |
Nine months of data across 24 sectors shows Americans have kept consuming, even as they steadily stopped feeling good about it.
|
|
|
Industry-level Index of Consumer Sentiment (ICS) and per capita consumption trends provide a clear, standardized way of keeping the pulse on category momentum. These metrics reveal whether a market is expanding or contracting, and whether consumer attitudes are becoming more or less favorable. ICS can be viewed as a bellwether for the "psychology" of a market, revealing consumer confidence and how they feel about the economy. Meanwhile, per capita consumption provides the "behavioral data," quantifying how much they are actually using various products and services. Together, these two metrics offer a powerful, holistic view of a category's momentum. Morning Consult has been publishing findings across 24 categories every week and the following report is a synthesis of what we have learned from the past 40 weeks. |
|
|
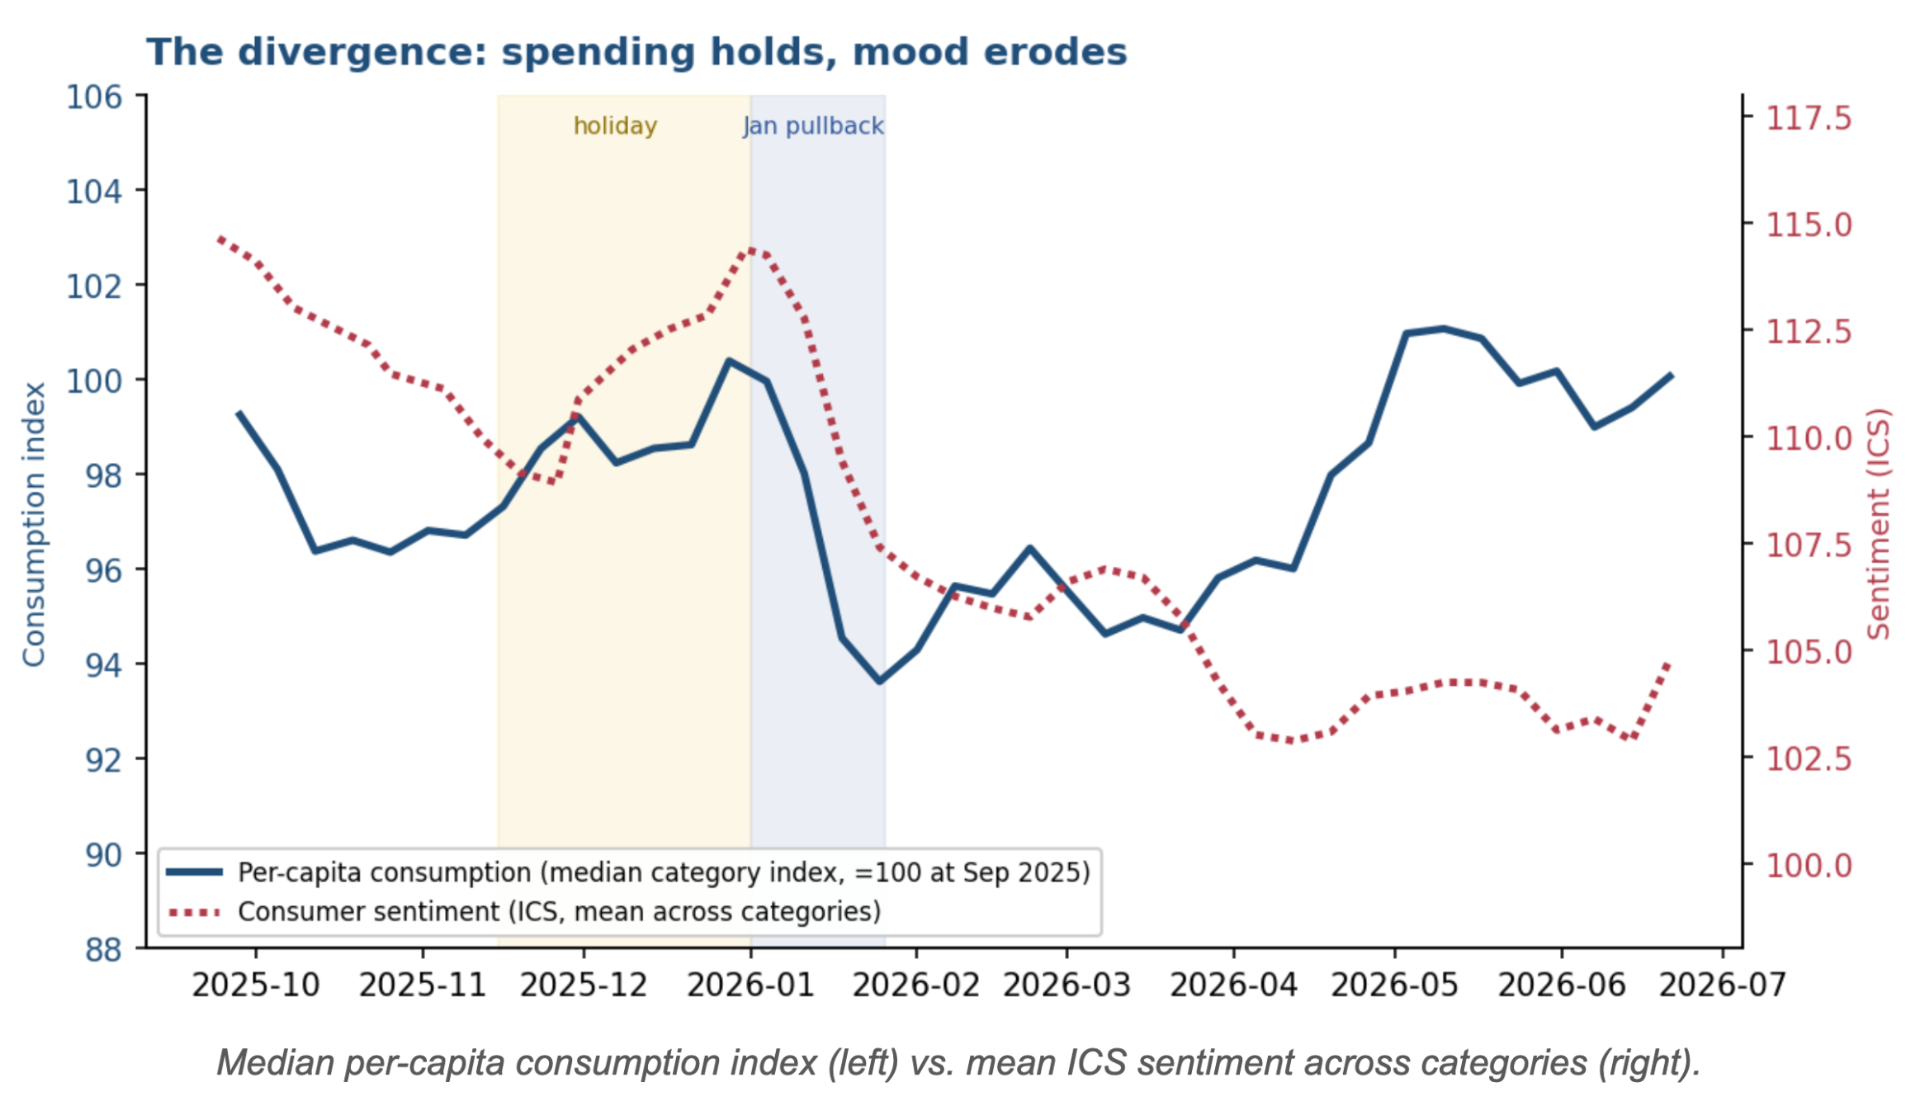
Forty consecutive weeks of consumption and sentiment data across 24 consumer categories tell one overarching story, and several useful sub-stories beneath it. The headline is a divergence that held for nine straight months: Americans kept consuming while they steadily stopped feeling good about it. Consumption held; sentiment eroded. Aggregate per-capita consumption ended the period almost exactly where it started, while consumer sentiment (ICS) fell among consumers in every one of the 24 categories — between 5 and 13 points each. Mood weakened far faster than behavior. Growth was a barbell, not a tide. Beneath the flat average, categories split sharply. Affordable everyday routines and digital utility grew — Breakfast Restaurants (+21%), AI Platforms (+11%), Department Stores (+10%), Energy Drinks (+8%), Grocery (+7%), Food & Bev Delivery (+6%). Big-ticket, speculative, and stock-up-goods categories shrank — Bottled Water (−23%), Gaming Consoles (−13%), Baby Products (−12%), Crypto (−9%), Pharmacy (−8%). The steadiest grower was the least glamorous. Breakfast Restaurants rose in roughly two-thirds of all weeks at the lowest volatility in the set — the profile of a structural habit forming, not a spike. The flashiest categories (Crypto, Gaming) were the most volatile and net-negative. Consumption moves in one big discretionary bloc. Out-of-home and mobility categories rise and fall together (Airlines–QSR correlate at 0.80; Airlines, Breakfast, Luxury Hotels, Automotive and Fitness all co-move), so a single macro impulse swings them in unison — useful for read-through and early warning. Two categories run counter-cyclically. Credit Card Networks and at-home Streaming strengthen when discretionary spending dips — the signatures of households leaning on credit and substituting the couch for the night out when budgets tighten. For anyone anyone making resource decisions based on a read of the consumer, the implication is that the aggregate “consumer is fine” headline is misleading. The consumer is selective: protecting affordable routines and digital tools, deferring big-ticket and discretionary goods, and doing it while confidence quietly drains. Position to the mix, not the average. |
|
|
The Central Divergence: Consumption Held, Mood Eroded |
The single most important pattern in nine months of data is the growing gap between what people did and how they felt. Sentiment peaked in the fall, slid through a brief holiday reprieve, dropped sharply in January, and settled into spring 5–13 points below where it began — a decline visible in literally every category. Consumption, by contrast, proved resilient: it wobbled with the calendar but ended the period roughly flat and even firmed into early summer. |
This is the defining feature of this consumer. A widening wedge between behavior and confidence is the macro signature of a population spending out of necessity and habit rather than optimism. It is also fragile: when behavior is propped up by habit while sentiment falls, the risk of a delayed step-down in discretionary categories rises. The aggregate masks it; the wedge reveals it. |
|
|
The Narrative Arc: A Calendar of Events |
Read in sequence, the weekly summaries trace a coherent, event-driven year that explains the swings around the flat trend: Fall 2025 — affordability under pressure. A prolonged government shutdown and benefit disruptions dominated the autumn, holding consumption soft and pushing value-seeking behavior to the fore. November–December — holiday pull-forward. Spending firmed into the holidays, led by electronics and gaming around the Black Friday period and by delivery and spirits through the gatherings, peaking in the final weeks of December. January — the necessity pivot. The sharpest behavioral move of the year: a broad discretionary pullback as the bills came due, with consumption dropping across most categories while grocery and pharmacy held — and credit-card volume spiking. Sentiment fell hardest here too. February–March — stabilization. Event beats (the Super Bowl, Valentine’s, tax season) produced short-lived category bumps against a generally flat, cautious backdrop; sentiment kept drifting down. April–June — selective re-acceleration. Spring and early-summer demand returned unevenly — travel, dining, automotive and spirits firmed into June while sentiment finally stabilized, though well below its September level. The events differ, but the response rhythm is constant: consumption flexes around the calendar and snaps back; sentiment only ratchets down. Behavior is elastic, confidence is sticky-to-the-downside. |
|
|
Where Consumption Grew and Shrank |
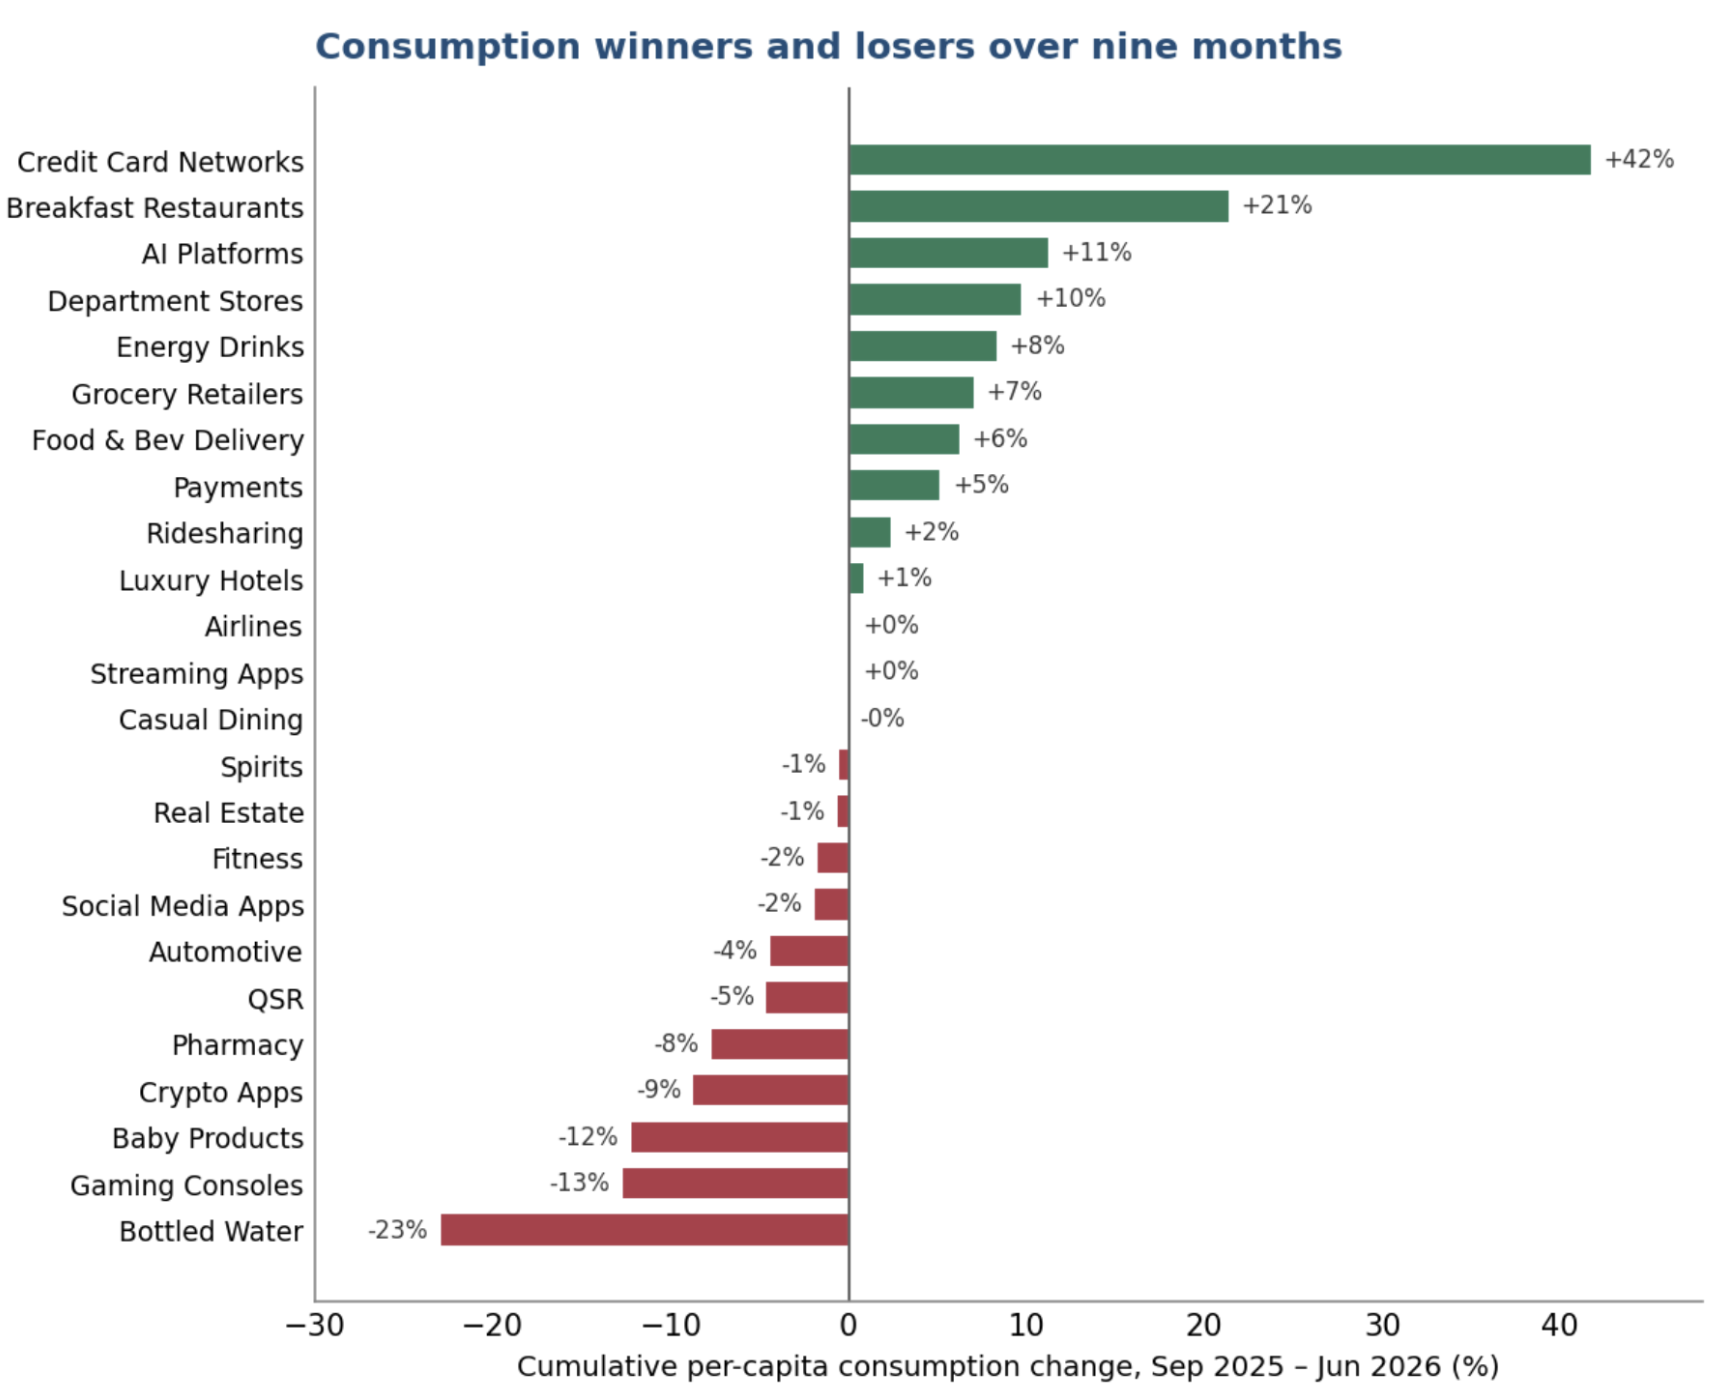
Cumulative per-capita consumption over the nine months sorts the 24 categories into a clear barbell. The growth end is dominated by affordable, repeatable, or utility-like consumption; the decline end by discretionary big-ticket purchases, speculative digital activity, and pandemic-era stock-up goods now unwinding. |
The winners share a logic: low unit cost, high frequency, or genuine utility. Breakfast and quick-service-adjacent dining, energy drinks, grocery, and delivery are small, repeatable outlays that survive a budget squeeze. AI Platforms’ climb reflects a genuinely new utility entering the routine. Credit Card Networks lead the entire set (+42%), but that is a transaction-volume signal as much as a demand signal — and, as Section 5 shows, it rises precisely when other spending falls. The losers share the opposite logic: deferrable, durable, or speculative. Gaming consoles and baby products are durable goods whose purchases can wait; crypto activity is discretionary and risk-sensitive; bottled water’s steep decline reads as a stock-up category normalizing. These are the first places a cautious household pulls back — and they did. |
|
|
Download: Most Trusted Brands 2026 |
Our annual ranking of the brands that are winning consumer trust is live. The 2026 Most Trusted Brands report covers over 180 consumer brands across 30 different rankings. |
|
|
Stability versus Volatility: The Risk Map |
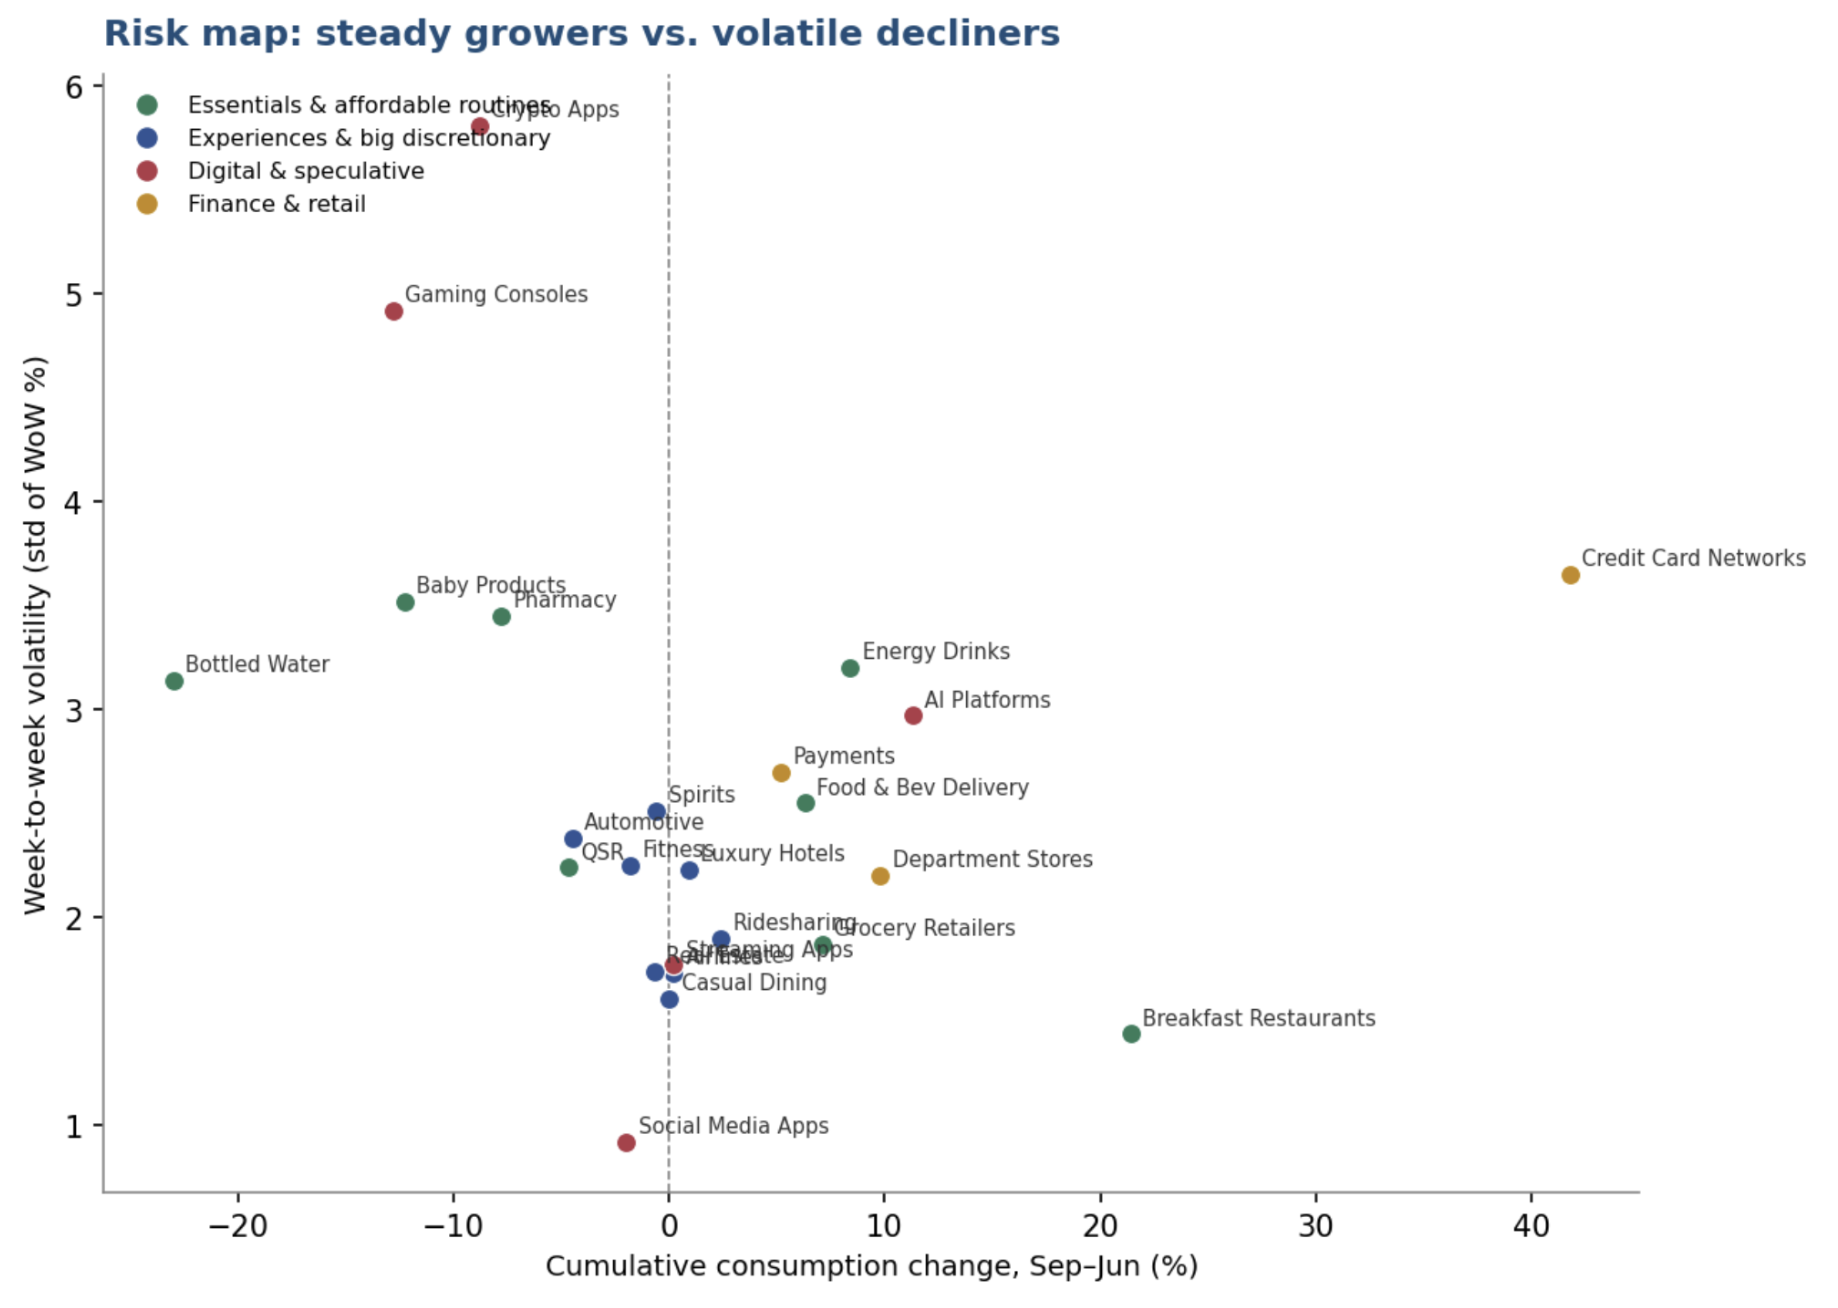
Direction is only half the story; steadiness is the other. Plotting each category’s cumulative growth against its week-to-week volatility separates durable trends from noisy ones and flags where a single weekly print should — and should not — be trusted. |
The lower-right quadrant — steady growth — holds the categories worth building a thesis on: Breakfast Restaurants, Grocery, Airlines, Food & Bev Delivery. These move in small, persistent increments. The upper-left — volatile and declining — holds Crypto and Gaming, where any single strong week is noise around a downtrend and should not be over-read. Social Media is almost perfectly flat and almost perfectly stable: a saturated utility. The practical rule: trust trend in the low-volatility categories, demand confirmation in the high-volatility ones. |
|
|
Implications and What to Watch |
Allocate to the mix, not the average. “Consumer consumption is stable” is true and misleading. The stability is a composition of affordable-routine growth offsetting big-ticket and speculative decline. The opportunity and the risk are both in the dispersion. Treat the sentiment wedge as a leading risk. Nine months of falling confidence beneath flat spending is a loaded spring. Watch the steady, high-frequency discretionary categories (breakfast, QSR, casual dining) for the first crack — they are where a confidence-driven step-down would show up first and most reliably. Use the counter-cyclical pair as an early-warning gauge. Rising credit-card-network volume together with softening discretionary consumption is a stress signature, not a demand signal. Track them as a pair. Read the fast categories for the slow ones. Within the out-of-home bloc, QSR and breakfast turn first; airlines, hotels and autos follow. The cluster’s leading members are a cheap early indicator for its lagging, higher-value members.
Method and caveats Consumption is per-capita, 3-week rolling; cumulative growth is chained from weekly growth rates Dates are week-ending (Monday); Co-movements are Pearson correlations of weekly per-capita changes and are descriptive, not causal. See Signals of Market Movements for Full methodology . |
|
|
One Always-On Consumer Signal. Two Complementary Solutions:
1. Intel Platform: AI-driven consumer and market research platform that transforms daily consumer surveys into clear, stakeholder-ready insight - helping leaders continuously monitor change and move from data to decision, faster.
2. Custom Research: On-demand market research built on the most advanced survey research technology to deliver solutions that are fast, scalable, cost-efficient, and built for action. |
|
|
Most research tells you what already happened. Morning Consult tells you what's coming. |
Most organizations are making decisions on research that wasn't built for the speed at which consumers and markets change today. Data is slow. Insights are fragmented. By the time analysis reaches leadership, the moment has already passed. Morning Consult changes that. From brand health and spending behavior to economic sentiment and political trends, we track the signals that move markets every day, so your team sees shifts coming before they show up in your numbers. |
|
|
|